Why Should You Make An Infographic
Posted on February 7, 2013
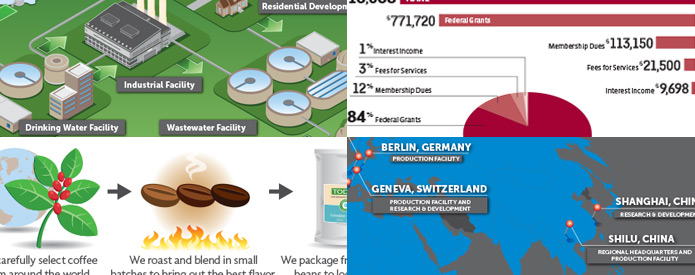
In layman's terms, an infographic is simply a visual representation of data. While they have grown increasingly popular in the web-prevalent world, they actually can be dated as far back to 7,500 BC. Infographics can be used to show everything from flow charts to relationships and timelines to product comparisons. The question is why should you spend your valuable time and money to create your own custom infographic? Trying to explain a convoluted, multi-tier flow chart in text form can get a bit complicated. By using an infographic, you can relay the same content but through a more visually exciting and open format. In nearly all forms of content, large blocks of text are ineffective: manuals, websites, books. Infographics allow readers to latch onto the visual element of the piece and absorb the content rather than being overwhelmed by a wall of words. As we discussed in a previous blog entry, infographics are exciting! With Pinterest and other social media outlets exploding, visually stimulating content can quickly go from living exclusively on your desktop to hundreds of sites around the world, all pointing back to your tiny little infographic. Before you know it, your project has been shared, and liked, and plus oned, and retweeted, and pinned. So not only do you gain all of the benefit of the search engine optimization perks, but you also establish yourself as an expert in the field. How intriguing do you think an expansive study on the scientific evidence of health supplements taken orally by adults would be, with radial access for specific information on musculoskeletal, infections, and general health issues? Not fun at all? Us either. But this brings us to one of our favorite infographics. Come on, click the link. It is awesome. You see that calcium and vitamin D have shown some promising effects on cancer and that chamomile has shown virtually no benefit on digestion issues. You can click on and off the respective ailments or supplements you are interested in and drill down into the more scientific findings for each. There are hundreds of actual reports that this infographic manages to capture in one single, interactive image. It would take weeks to comb through all of the various studies that are cited, likely curing anyone's sleep issues, but this infographic manages to take a fairly mundane topic and make it interactive and exciting to play around with. So the world of infographics can serve your business in multiple ways. Please feel free to share any of your favorite infographics or your own for everyone to enjoy!![]()
![]()
![]()
![]()
Usability
Viral
Fun